The POR and SOR systems introduce us to the identification of systems since through the modeling of these we can choose, indicate and identify which is the best controller for a specific industrial process by subjecting it to a unit step.
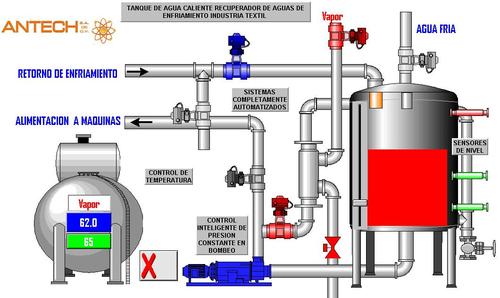
Therefore, in the recent laboratory practice, a series of mathematical parameters based on a series of equations were taken to describe which of the systems works under optimal conditions based on the proposed graphics.
SYSTEM IDENTIFICATION: APPROXIMATION OF PADÉ
OBJECTIVE . Develop non-parametric systems identification, finding approximations to first and second order models with delay.
First order plant model with delay (Model POR). The transfer function corresponding to this type of plant is given by:
![]()
Where K is the gain of the plant, θ the delay and T the time constant. The experimental procedure to obtain the model consists in opening the control loop before the final control element and creating a change in the process step. The response of the system is plotted and on the curve obtained the analysis is made to estimate the values of the gain, the time constant and the delay. In the curve obtained as a response, two representative points are chosen, for which the response reaches 28.3% and 63.2% of its final value.
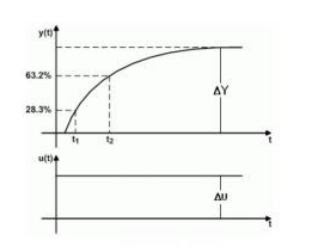
The following equations are presented with the data obtained from the graph:
The values of t1 and t2 are calculated directly from the graph or from the database obtained. Simultaneously solving the system of equations. The value of the gain is obtained by the ratio between the change of the output variable and the change in the input variable.
![]()
Second order plant model with delay (SOR model). The transfer function corresponding to this type of plant is given by:

Where:

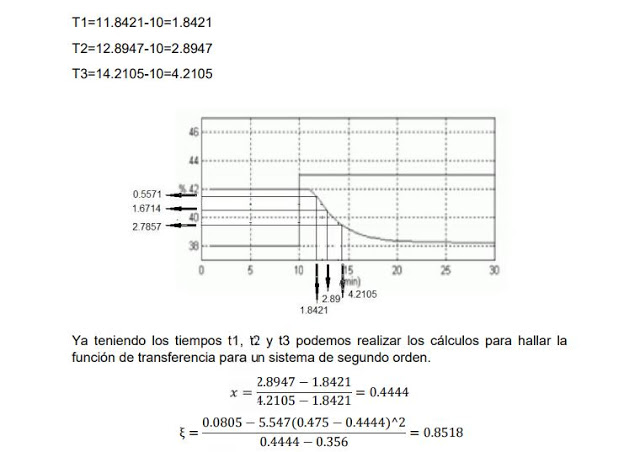
K being the gain of the plant, wn the natural frequency, ξ the damping coefficient, θ the delay and T1, 2 the time constants. The experimental procedure to estimate the model consists in obtaining the reaction curve or the process database, from the application of steps within the work area as indicated above for the POR model. In this case the points are selected correspond to those for which the response of the system has reached 15%, 45% and 75% of the total value of the change experienced by the system before the application of the step.
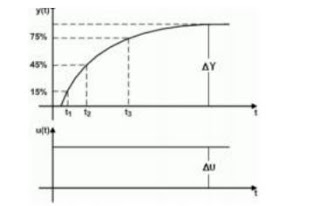
The following equations are presented with the data obtained from the graph:
SYSTEM IDENTIFICATION: APPROXIMATION OF PADÉ
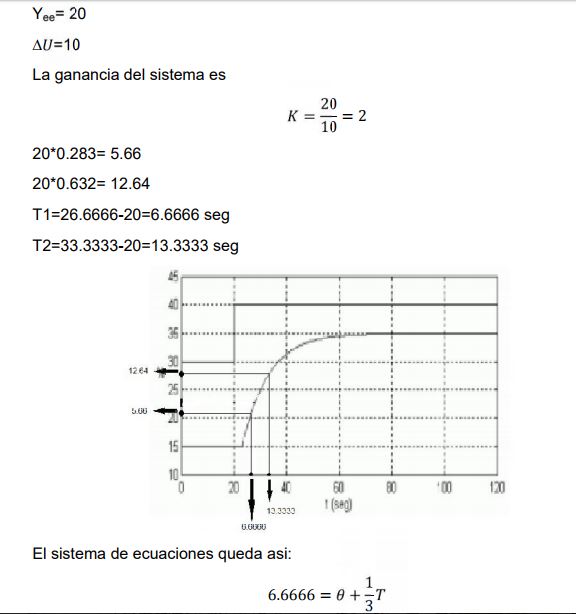
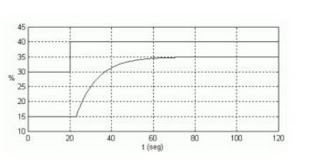
The values obtained with the equations are replaced to obtain the system parameters. Process. 1. The graphs correspond to the response in open loop, of different processes before a step input. Obtain their corresponding mathematical models by approximating them to a first order and second order system with delay.
FIRST GRAPH
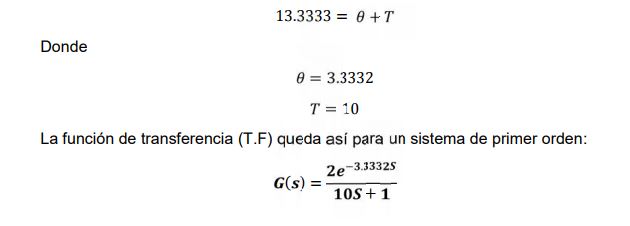
Already with the data of the times the equations for a Second Order System are solved, as follows:

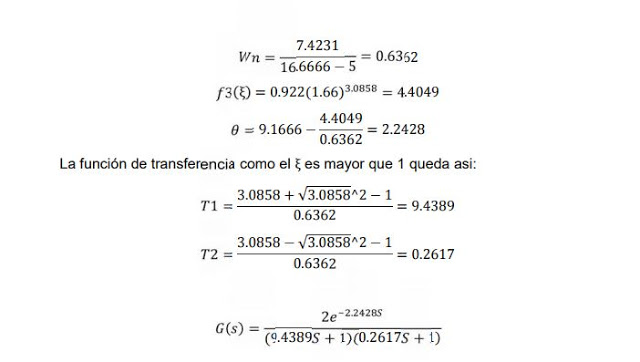
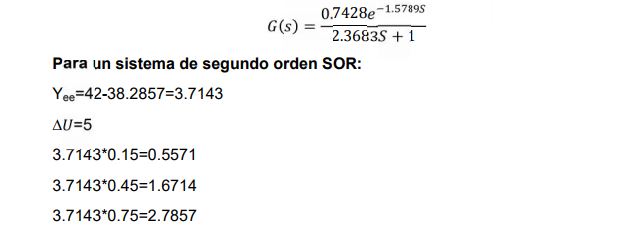
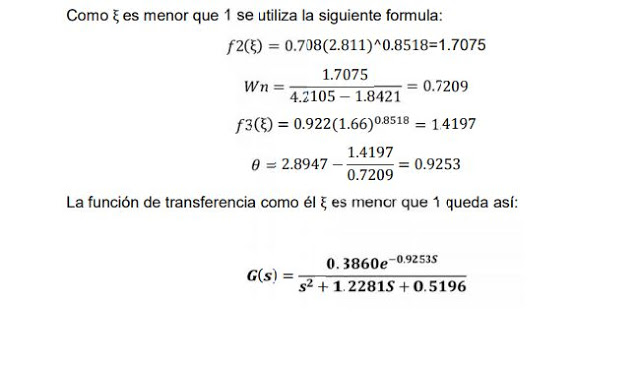
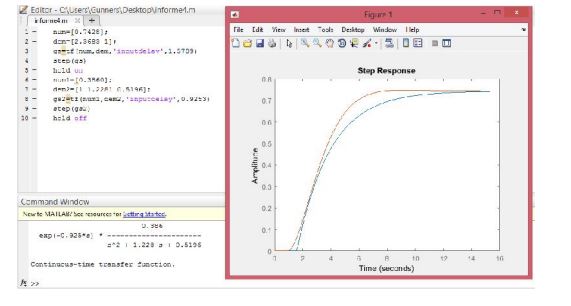
Obtain the response graph in MATLAB of the transfer functions obtained in the previous numbers. Use the step signal as input stimulus. The response to a step input for SOR and POR of the first graph:
The response to a step input for SOR and POR of the second graph:
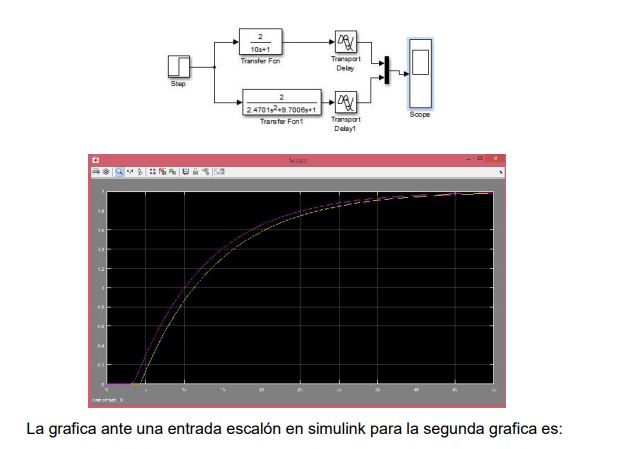
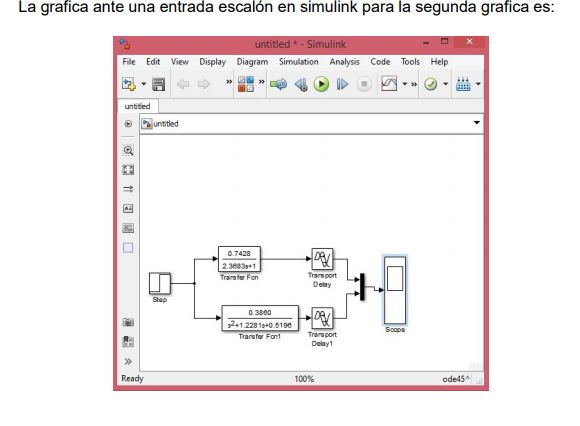
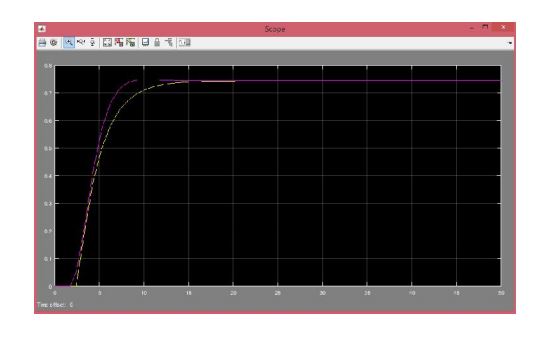
Obtain the response graph in SIMULINK of the transfer functions obtained in the previous numbers. Use the step signal as input stimulus. The graph before a step input in simulink for the first graph is:
SYSTEM IDENTIFICATION: APPROXIMATION OF PADÉ
CONCLUSIONS
What is learned in class is deepened, how to know the transfer function through a reaction curve for both a first-order and second-order system.
The delay of the POR system is greater than that of the SOR system, which is true for both graphs.
Therefore, the SOR system only for these two cases responds faster.
Both simulink and the code gave the same graphics.
The method is very experimental because to get the times and magnitudes in the different percentages may not be the most accurate then the transfer function can generate errors.
Reference
OGATA, KATSUHIKO . Modern Control Engineering 3rd edition

